WARWICK, R.I., Nov. 15, 2022 — InsureMyTrip.com researchers evaluated popular cruise lines and found while many offer basic travel insurance perks, few cruise lines offer robust trip cancellation insurance or expansive emergency medical care coverage.
The findings suggest cruisers should review travel insurance coverage advertised by their cruise line to understand what exactly it covers – and what it doesn’t.
“We recommend cruisers compare coverage with a travel insurance comparison website before choosing a plan offered through a cruise line,” says Meghan Walch, Director of Product for InsureMyTrip. “Cruisers will likely discover traditional travel insurance aka 3rd party travel insurance, available on InsureMyTrip, offers far more coverage options, often at a lower price.”
Cruise Line Travel Protection Drawbacks
Trip Cancellation – Limited number of reasons for canceling a trip.
Pre-existing conditions – Often not covered. Older travelers and those traveling with a condition could find themselves not covered if they need to cancel/interrupt or seek medical attention during the trip for the condition.
Medical coverage – Typically lower than what we see on 3rd party travel insurance plans.
Cancel for Any Reason – Typically offered through the cruise line as a type of waiver, and reimburses credits/voucher, not cash as a third-party plan would.
Financial default – Not covered for the bankruptcy of a cruise line or common carrier.
Full trip coverage – Most cruise plans will not cover the cost of the entire trip. So, those booking flights and accommodations separately from the cruise, would need separate insurance to cover those expenses.
Inconvenience benefits – Often not included through cruise line protection.
Cruise Line Travel Protection vs. 3rd Party Travel Insurance
Coverage Type
Cruise Line
Travel Protection
3rd Party Travel Insurance
(available on InsureMyTrip)
Cancel For
Any Reason
No Cash, Credits Only
Cash
Trip
Cancellation
Limited Covered Reasons
Many Covered Reasons
Emergency
Medical
Low Limits
High Limits
Pre-Existing
Conditions
No
Yes
Trip Cost
Only Cruise Insurable
All Costs Insurable
Financial
Default
No
Yes
Baggage
Delay
Delay Must
Be Many Hours
Few Hours
Bottom line – your cruise line may offer some protection. However, it will likely not provide the same amount of coverage available from traditional travel insurance.
A comprehensive travel insurance plan purchased from InsureMyTrip can cover your prepaid, non-refundable trip cost, including flights and accommodations, in addition to providing robust key benefits including trip cancellation, emergency medical coverage, emergency medical evacuation, trip interruption, trip delay, baggage coverage, and 24/7 emergency assistance. Typically, these plans will run 4-8 percent of a total trip cost.
Travelers can find a breakdown of cruise line trip protection vs. 3rd party travel insurance on InsureMyTrip’s “Cruise Travel Insurance Hub”.
It’s simple. InsureMyTrip finds you the right travel insurance plan, every time. InsureMyTrip is the authority on travel insurance. We are committed to empowering travelers to make the best possible insurance decisions by leveraging our technology, data intelligence, and expertise. InsureMyTrip is rated A+ by the Better Business Bureau.
The holidays are a popular time for travel, and many travelers get into the spirit by visiting cheery locations that inspire seasonal joy. From Minneapolis to Miami, we reviewed 100 cities across the United States to identify which were the most festive. We collected data to determine the jolliest locations based on the following criteria: number of Christmas markets, holiday events, festive tours, the chance of snow, and number of searches for ‘Christmas in …’.
We hope this gives holiday travelers destination inspiration as they’re looking for festive locations when planning their next trip.
Rank
City / State
State
Overall
1
Rochester,New York
New York
6.1
2
Buffalo,New York
New York
5.7
3
Syracuse,New York
New York
5.3
4
New York City,New York
New York
5.1
5
Grand Rapids,Michigan
Michigan
4.9
6
Anchorage,Alaska
Alaska
4.8
7
Salt Lake City,Utah
Utah
4.7
8
Chicago,Illinois
Illinois
4.5
9
Cleveland,Ohio
Ohio
4.5
10
Denver,Colorado
Colorado
4.4
11
Detroit,Michigan
Michigan
4.4
12
Minneapolis,Minnesota
Minnesota
4.4
13
Columbus,Ohio
Ohio
4.3
14
Pittsburgh,Pennsylvania
Pennsylvania
4.3
15
Boise,Idaho
Idaho
4.2
16
Boston,Massachusetts
Massachusetts
4.1
17
Spokane,Washington
Washington
4.0
18
Colorado Springs,Colorado
Colorado
3.9
19
Milwaukee,Wisconsin
Wisconsin
3.8
20
Indianapolis,Indiana
Indiana
3.6
21
Madison,Wisconsin
Wisconsin
3.6
22
Albany,New York
New York
3.5
23
Nashville,Tennessee
Tennessee
3.5
24
Omaha,Nevada
Nevada
3.5
25
Cincinnati,Ohio
Ohio
3.4
26
Mesa,Arizona
Arizona
3.4
27
Des Moines,Iowa
Iowa
3.3
28
Kansas City,Missouri
Missouri
3.3
29
Louisville,Kansas
Kansas
3.3
30
Asheville,North Carolina
North Carolina
3.2
31
Bozeman,Montana
Montana
3.1
32
Honolulu,Hawaii
Hawaii
3.1
33
Providence,Rhode Island
Rhode Island
3.1
34
Reno,Nevada
Nevada
3.1
35
St. Louis,Missouri
Missouri
3.0
36
Fort Worth,Texas
Texas
2.9
37
Seattle,Washington
Washington
2.9
38
Tampa,Florida
Florida
2.9
39
Portland,Oregan
Oregan
2.8
40
Charlotte,North Carolina
North Carolina
2.7
41
Memphis,Tennessee
Tennessee
2.7
42
Savannah,Georgia
Georgia
2.7
43
Atlanta,Georgia
Georgia
2.6
44
Philadelphia,Pennsylvania
Pennsylvania
2.6
45
Raleigh,North Carolina
North Carolina
2.6
46
Virginia Beach,Virginia
Virginia
2.6
47
Albuquerque,New Mexico
New Mexico
2.5
48
Orlando,Florida
Florida
2.5
49
San Diego,California
California
2.5
50
Springfield,Massachusetts
Massachusetts
2.5
51
Dallas,Texas
Texas
2.4
52
Arlington,Texas
Texas
2.3
53
Greenville,South Carolina
South Carolina
2.3
54
Houston,Texas
Texas
2.3
55
Las Vegas,Nevada
Nevada
2.3
56
Oklahoma City,Oklahoma
Oklahoma
2.3
57
San Antonio,Texas
Texas
2.3
58
Birmingham,Alabama
Alabama
2.2
59
Charleston,South Carolina
South Carolina
2.2
60
Clearwater,Florida
Florida
2.2
61
Fort Lauderdale,Florida
Florida
2.2
62
Hartford,Connecticut
Connecticut
2.2
63
Valparaiso,Indiana
Indiana
2.2
64
Austin,Texas
Texas
2.1
65
Jacksonville,Florida
Florida
2.1
66
Ontario,California
California
2.1
67
San Francisco,California
California
2.1
68
Baltimore,Maryland
Maryland
2.0
69
Miami,Florida
Florida
2.0
70
Tulsa,Oklahoma
Oklahoma
2.0
71
Knoxville,Tennessee
Tennessee
1.9
72
Myrtle Beach,South Carolina
South Carolina
1.9
73
New Orleans,Louisiana
Louisiana
1.9
74
Fort Myers,Florida
Florida
1.8
75
Los Angeles,California
California
1.8
76
Norfolk,Wirginia
Wirginia
1.8
77
Oakland,California
California
1.8
78
Santa Ana,California
California
1.8
79
Richmond,Virginia
Virginia
1.7
80
Sarasota,Florida
Florida
1.7
81
Long Beach,California
California
1.6
82
Phoenix,Arizona
Arizona
1.6
83
Tucson,Arizona
Arizona
1.6
84
West Palm Beach,Florida
Florida
1.5
85
Pensacola,Florida
Florida
1.4
86
San Jose,California
California
1.4
87
Burbank,California
California
1.3
88
Little Rock,Arizona
Arizona
1.3
89
Panama City,Florida
Florida
1.3
90
Sacramento,California
California
1.3
91
Kahului,Hawaii
Hawaii
1.1
92
Palm Springs,California
California
1.1
93
Sanford,Florida
Florida
1.1
94
El Paso,Texas
Texas
0.8
95
Fresno,California
California
0.8
96
Kailua Kona,Hawaii
Hawaii
0.8
97
Key West,Florida
Florida
0.8
98
Punta Gorda,Florida
Florida
0.7
99
Dulles,Virginia
Virginia
0.6
100
Lihue,Hawaii
Hawaii
0.2
Traveling for a White Christmas
For many, the concept of a ‘White Christmas’ has been endlessly romanticized. For some states, the idea of a White Christmas is little more than a fantasy whilst others have come to expect it.
New York’s Rochester, Syracuse, and Buffalo dominate the competition when comparing the chance of snow in cities across the country. Both Rochester and Syracuse score just under a 50% chance of snowfall throughout the Christmas period, while Buffalo maintains a 39% probability.
Excluding the leading state, Grand Rapids, Michigan followed close behind in fourth, accompanying state partner Detroit in the top 10. Anchorage, Alaska registered fifth place, with Spokane, Washington in sixth place.
For those who prefer to avoid the snow, 39 cities recorded a 0% chance of snowfall. Notably, these states all reside within the country’s southern region.
Number of Christmas Markets
Looking for a classic Christmas market in the upcoming holidays? We looked at the number of Christmas markets in each city, helping those who love holiday shopping to plan their next adventure.
New York City leads our list of cities in Christmas markets, with a total of 6. Denver, Colorado, Colorado Springs, Colorado, Portland, Oregon and Las Vegas, Nevada tie for second place with 5 Christmas markets each. Six cities tie for third place: Albuquerque, New Mexico, Raleigh, North Carolina, Omaha, Nevada, Nashville, Tennessee, Boston, Massachusetts and Boise, Idaho.
Alternatively, 25 U.S. cities reportedly host no Christmas markets. Surprisingly, only half of these destinations reside in the southern part of the country. Of the remaining cities, Grand Rapids, Michigan, and Spokane, Washington, were still able to score highly overall, despite their lack of any markets.
Number of Winter Tours
When traveling during the winter, it’s essential to ensure that activities are still available. Winter tours can range from Christmas light tours In New York to kayaking in Orlando, Florida. The number of winter tours has been highlighted below.
Picturesque holiday destinations Honolulu (10), Miami (6.8), and Fort Lauderdale (6.6) seize the top three spots. Unsurprisingly cities residing within Hawaii, Florida, and California dominate the top end of this list. Whilst the weather still cools in these states their top event spots remain the same – surf locations, national parks, and theme parks.
27 locations do not provide any winter tours, with overall high-scoring Grand Rapids, Michigan appearing among these. Other high-scoring standouts are Spokane and Minneapolis.
Number of Christmas Events
Christmas events are staged holiday performances providing festive entertainment.
The results displayed diversity in locations across the U.S. Fort Worth Texas hosts the most Christmas events boasting an impressive 147 with Ontario, California (142) and Columbus, Ohio (138) following close behind.
Lihue, Kailua Kona, and Kahului record the least Christmas events, meaning Hawaii may not cater to your staged entertainment festivities. These locations can provide as few as two Christmas events during the holiday period.
100 Cities Worth of Festivities
Incorporating all the previous data points into one score allows us to identify the most festive city.
Rochester, New York tops the list with a score of 6.1, followed closely by Buffalo (5.7) and Syracuse (5.3), which are also both located in New York. While spending Christmas in New York City (5.1) remains a bucket list item for many, results reveal the city’s state counterparts may be better destinations to visit during the holidays.
Outside of the state of New York, Grand Rapids, Michigan (4.9), Anchorage, Alaska (4.8) and Salt Lake City, Utah (4.7) all place highly.
Separately the least outwardly festive cities are Lihue, Hawaii (with a score of 0.2), Dulles, Virginia (0.6) and Punta Gorda, Florida (0.7).
Conclusion
To recap, the possibility of snow has a large impact on the perceived festive spirit of a city, thus potentially impacting the Christmas-related industries that follow.
The number of Christmas markets per city is highly competitive across the country, distributed fairly evenly across the regions.
The U.S. leading summer vacation destinations dominated the Winter Tours section. Whilst Winter Tours are not directly related to a traditional Christmas, they are essential for many in providing entertaining activities across the holiday season.
Christmas Events are the less active form of entertainment, though they presented the opposite in results. Hawaii and Florida’s cities are placed around the bottom of this list.
Methodology
Each data point consists of the latest research available from reputable sources. All sources are destination specific level data points. The data was standardized using minmax normalization. The minmax normalization value is multiplied by 10 to create a score (between 0-10). A score of 10 is always the best result, while a score of 0 is the worst. Each city is then ranked on their overall rating across all festive data points, to find which city is the most festive.
InsureMyTrip isolated each data point in addition to giving an overall category score. This will give families an opportunity to target destinations for individual points (e.g. chance of snow, number of Christmas markets or number of winter tours). Alternatively, the “Overall” category score gives a general view of which city is the most festive.
Sources
Winter Tours
The number of tours on Expedia between the 18th- 31st December under the search ‘Christmas’.
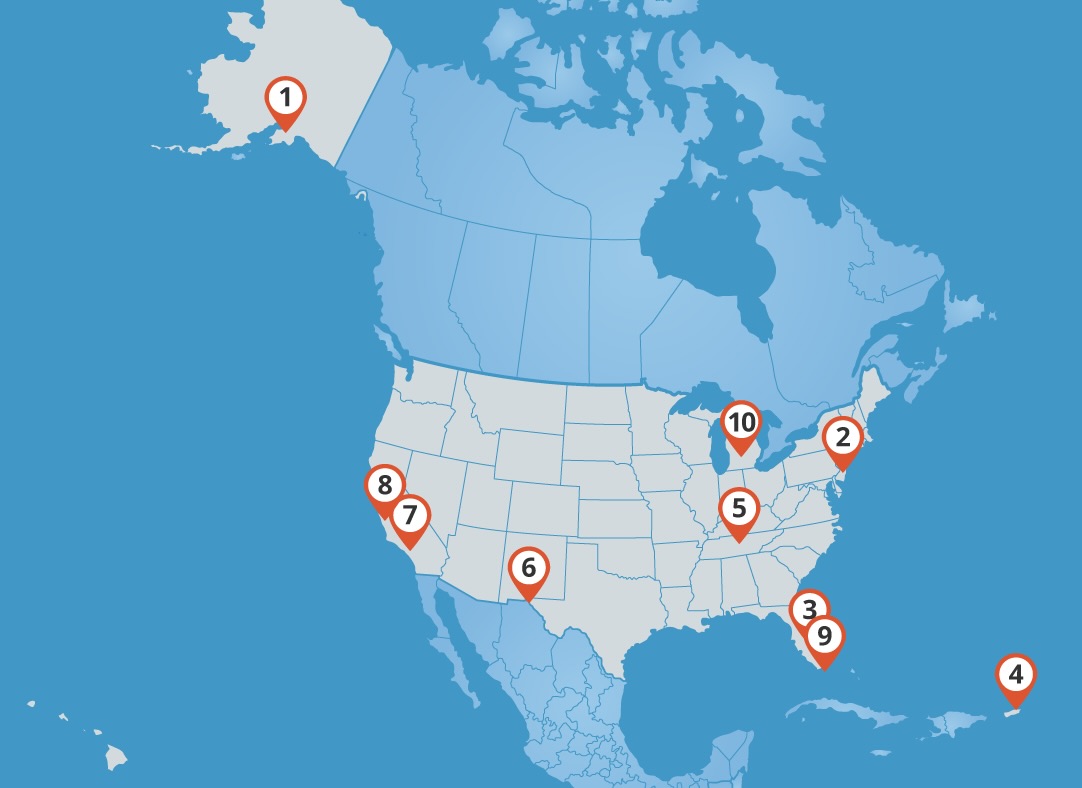
With traveler numbers returning to pre-pandemic levels, airports are navigating their way through an increasing surge of eager travelers. While the return to travel is a sigh of relief for many, travel over the holidays remains a stressful thought for some. To help travelers prepare for a busy holiday season, we identified the worst performing airports in the U.S. by looking at data collected from 2019-2021 encompassing various negative factors.
#
Airport Name / City
City
Overall Average
1
Ted Stevens Anchorage InternationalAnchorage
Anchorage
27.2%
2
Newark Liberty InternationalNewark
Newark
23.6%
3
Palm Beach InternationalWest Palm Beach
West Palm Beach
21.7%
4
Luis Munoz Marin InternationalSan Juan
San Juan
21.1%
5
Nashville InternationalNashville
Nashville
19.8%
6
El Paso InternationalEl Paso
El Paso
19.7%
7
Hollywood BurbankBurbank
Burbank
19.5%
8
San Francisco InternationalSan Francisco
San Francisco
19.3%
9
Fort Laurderdale-Hollywood InternationalFort Lauderdale
Fort Lauderdale
19.2%
10
Gerald R. Ford InternationalGrand Rapids
Grand Rapids
18.7%
The Worst Performing Airports Overall
Statistically, these are America’s worst airports for delays, cancellations, and diversions.
Ted Stevens Anchorage International in Alaska performed the worst overall, with a 27.15% chance of delay. System delays, with an 8.32% chance of causing delay, and late aircraft arrivals with a 7.06% chance of causing delay, appear to be this airport’s downfall.
Newark Liberty International in New Jersey grasped 2nd place, with an overall average of 23.55% chance of delay. It has a 12% chance of a system delay which is around 4% more likely to hold you up in comparison to Anchorage International, which has an average system delay of 8%.
Air carrier delays present a challenge for all airports, as this may cause a hold-up when preparing for boarding. Luis Munoz Marin International in Puerto Rico and El Paso International in Texas led this category, with 10.27% and 9.05% respectively, potentially signifying issues regarding staff.
The Best Performing Airports Overall
For travelers looking for the top performers, these airports can be considered the best as a result of less delayed, cancelled, or diverted flights.
Atlanta’s Hartsfield-Jackson International in Georgia has been crowned the best or most efficient airport with a 14.39% chance of experiencing any issues. They boast a tiny 0.04% possibility of being diverted or delayed due to security problems on average.
BWI Marshall in Maryland is awarded least likely to sustain weather difficulties, recording just a 0.12% chance of weather-related delays on average. Narrowly beating Chicago Midway International in Illinois and George Bush Intercontinental in Texas, which both had an average weather delay of 0.14%.
Alternatively, Hawaii’s Kahului International, at 2.8% and Daniel K Inouye International, at 3.4%, held 2 of the 3 lowest percentages for late aircraft arrivals, proving to be well organized despite high levels of tourist traffic.
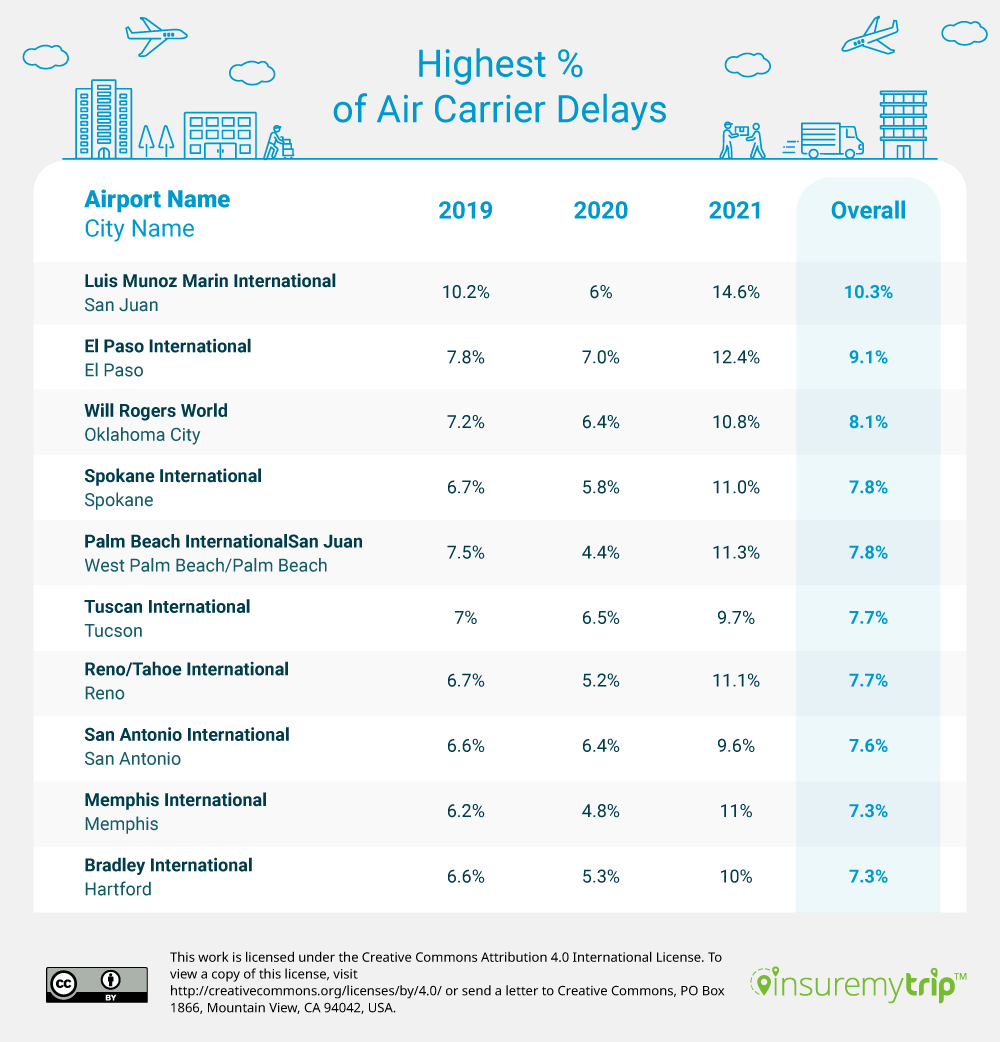
Worst Air Carrier Delays
These airports average the most delays due to the operating airline preparations.
Across the three years presented it is clear to see a contrast in results, best explained by the COVID-19 pandemic. 2020 presents a decrease in delays, potentially due to the decrease in overall flights. However, 2021’s influx of holidays and business travel has pushed these airports to the brink.
Puerto Rico’s Luis Munoz Marin International endured the most air carrier delays across the three years, recently jumping from 6% in 2020 to a whopping 14.6% last year. This airport also sustained the largest decrease from 2019-2020, suggesting the pandemic severely halted Puerto Rico’s tourism industry.
Despite this, Tucson International in Arizona appeared to take pride in delivering consistently poor service, fluctuating the least of all the airports on this list throughout the three-year period with an overall average of 7.7%.
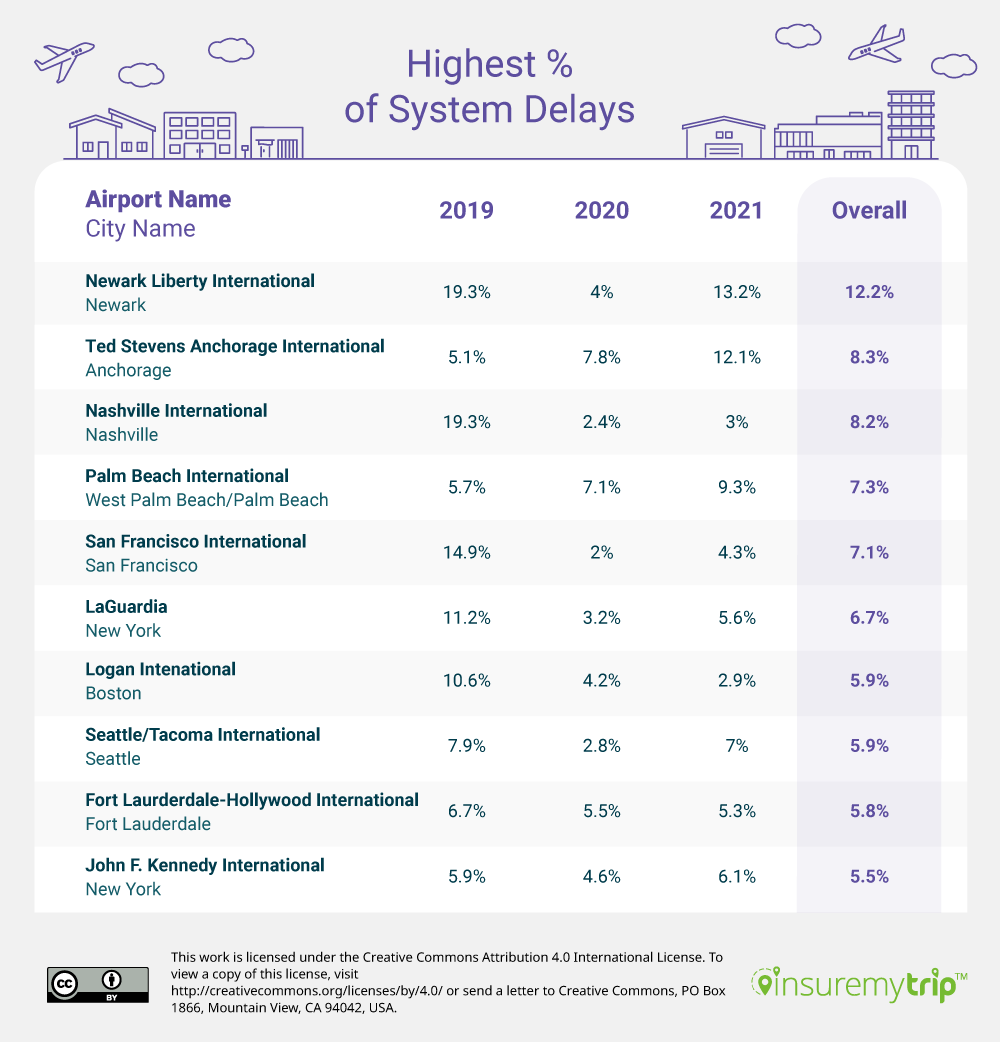
System Delays between 2019-2021
System delays are identified by being within the control of the National Airspace System (NAS), this includes operations, traffic volume, and traffic control. The airports listed show an overall percentage alongside another three-year comparison.
Newark Liberty International dominates this sector, with 12.2%. However, the real standout lies in 3rd place. In 2021 Nashville International held 19.3% (2019) but has since dropped to 2.96% (2021) despite all flights reopening. This indicates huge improvements as the number of flights put on was just 230 less in 2021 with 11,192, than in 2019 with 11,422.
Both New York airports; John F. Kennedy International, with 5.53%, and LaGuardia, with 6.65%, appear in this list, possibly due to the heavy amounts of traffic the city receives. Nevertheless, an area for improvement.
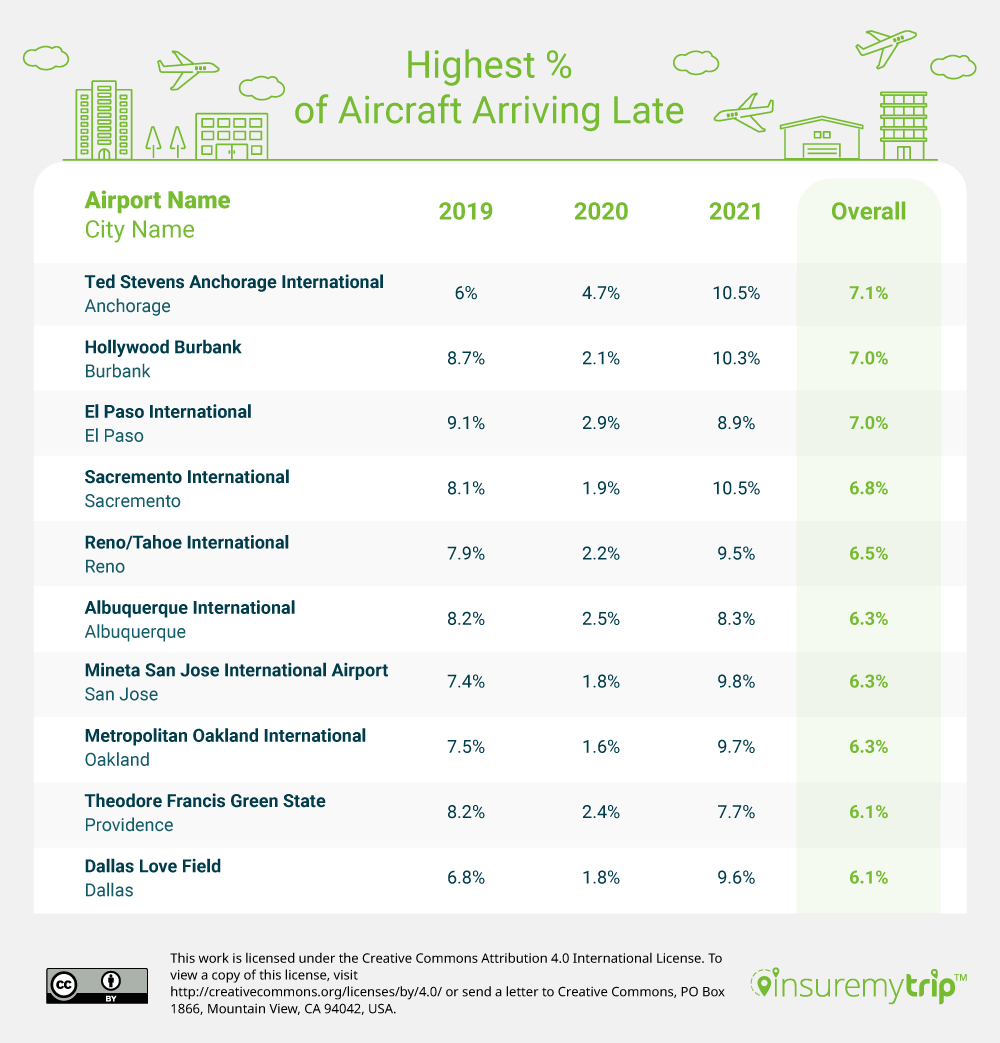
Late Aircraft Arrivals
This list identifies the airports with the most frequent number of previous flights arriving late, causing the present flight to depart late.
The top 10 list only differentiates 1.01%, with a 4.3% difference across all data gathered, the tightest of all the data sets.
As previously mentioned, Anchorage performed the worst in this category with 7.06% of delays caused by late aircraft arrivals. Next is Hollywood Burbank with 7.02% and El Paso International with 6.96%.
What do Hollywood Burbank (7.02%), Sacramento International (6.96%), Mineta San Jose International Airport (6.33%) and Metropolitan Oakland International (6.27%) all have in common? They are all in California, with 4 out of the 10 worst performing airports, California, is the worst state for aircraft arriving late.
Overall
Ted Steven’s Anchorage International was named the worst performing airport overall. System delays and late aircraft arrivals were identified as the airport’s weakest aspects.
Atlanta’s Hartsfield-Jackson International was crowned the best performing, scoring as low as 0.04% in diversions and security delays.
Whilst acknowledging the pandemics’ influence the data still presented valuable insights, as already this year we’ve seen major issues with airports struggling to return to pre-pandemic levels of travelers.
The first is how the contextual impacts on tourism have potentially led to difficulties surrounding delays. Specifically, Puerto Rico’s Luis Munoz Marin International is enduring a large increase in air carrier delays. Though it can be noted Tucson International remained consistently poor across the three-year period.
Nashville International in Tennessee seized the spotlight regarding system delays, having decreased by 16.3% throughout 2019-2021. Signifying either major improvements or a decrease in tourism.
Lastly, the late aircraft arrival list presents a minimal differentiation across 1st to 10th place, with airports within California standing out with some of the highest delays.
Methodology
InsureMyTrip gathered data from the Bureau of Transportation Statistics over November and December for 2019, 2020 and 2021. An overall percentage was then gathered, taking the overall percentage from each year and dividing it by the number of years.
An average was also created from the three biggest reasons for flights to be delayed or canceled.